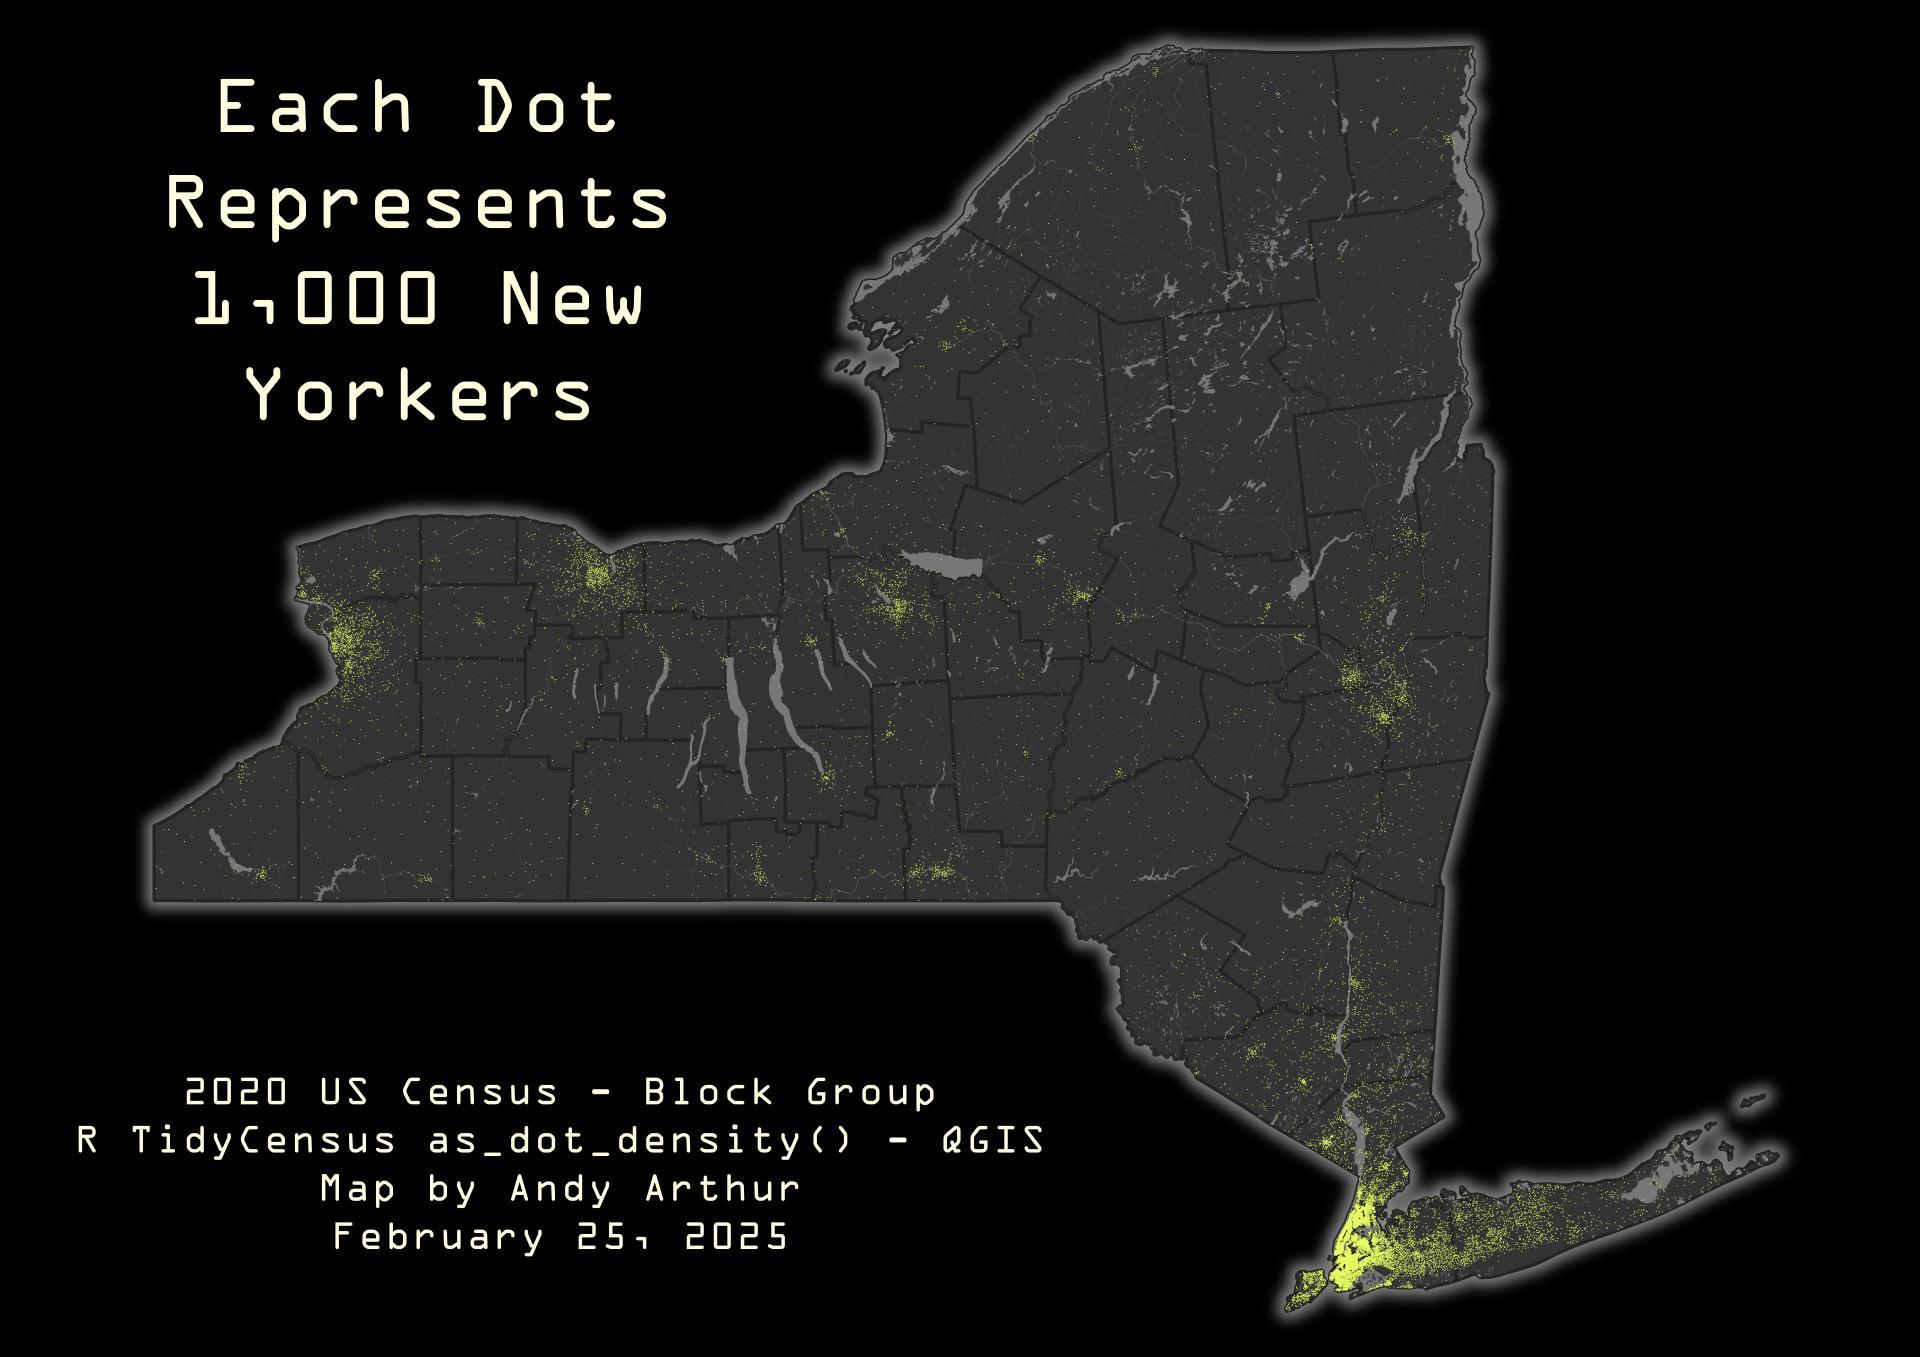
SVGZ Graphic: Central NY Population Density

More about NYS Census...

New York State mapped and discussed, using Census data. Lots of interesting infographics can be found here.

SVGZ Graphic: 19 percent of Upstate New Yorkers live in towns with fewer than 100 people per square mile
SVGZ Graphic: 25 Most Densely Population Municipalities in New York State
SVGZ Graphic: 25 Most Sparsely Population Municipalities in New York State
SVGZ Graphic: 25 Wealthiest Municipalities in New York State
SVGZ Graphic: Adirondack Park Blowdown - November 1950
SVGZ Graphic: Gender of Population
SVGZ Graphic: Median Age in the Capital Region
SVGZ Graphic: Most and Least Educated - Wealthy Municipalities in NYS
SVGZ Graphic: NY Population Change, 2021-2022
SVGZ Graphic: Population Change from 1974 to 2024
SVGZ Graphic: Race and Income in New York
SVGZ Graphic: Rural Population vs Rural Landmass
SVGZ Graphic: Where People Who Work Downtown Live
Thematic Map: 2020 US Census Urban Areas in New York State
Thematic Map: 9 Out of Ten New Yorkers Live Here
Thematic Map: Fifty Least Densely Populated Municipalities in NY State
Thematic Map: New York Counties Ranked from Poorest to Wealthiest
Thematic Map: New York State County Population Density
Thematic Map: Walking Distance from Home

Leave a Reply

Your email address will not be published. Required fields are marked *