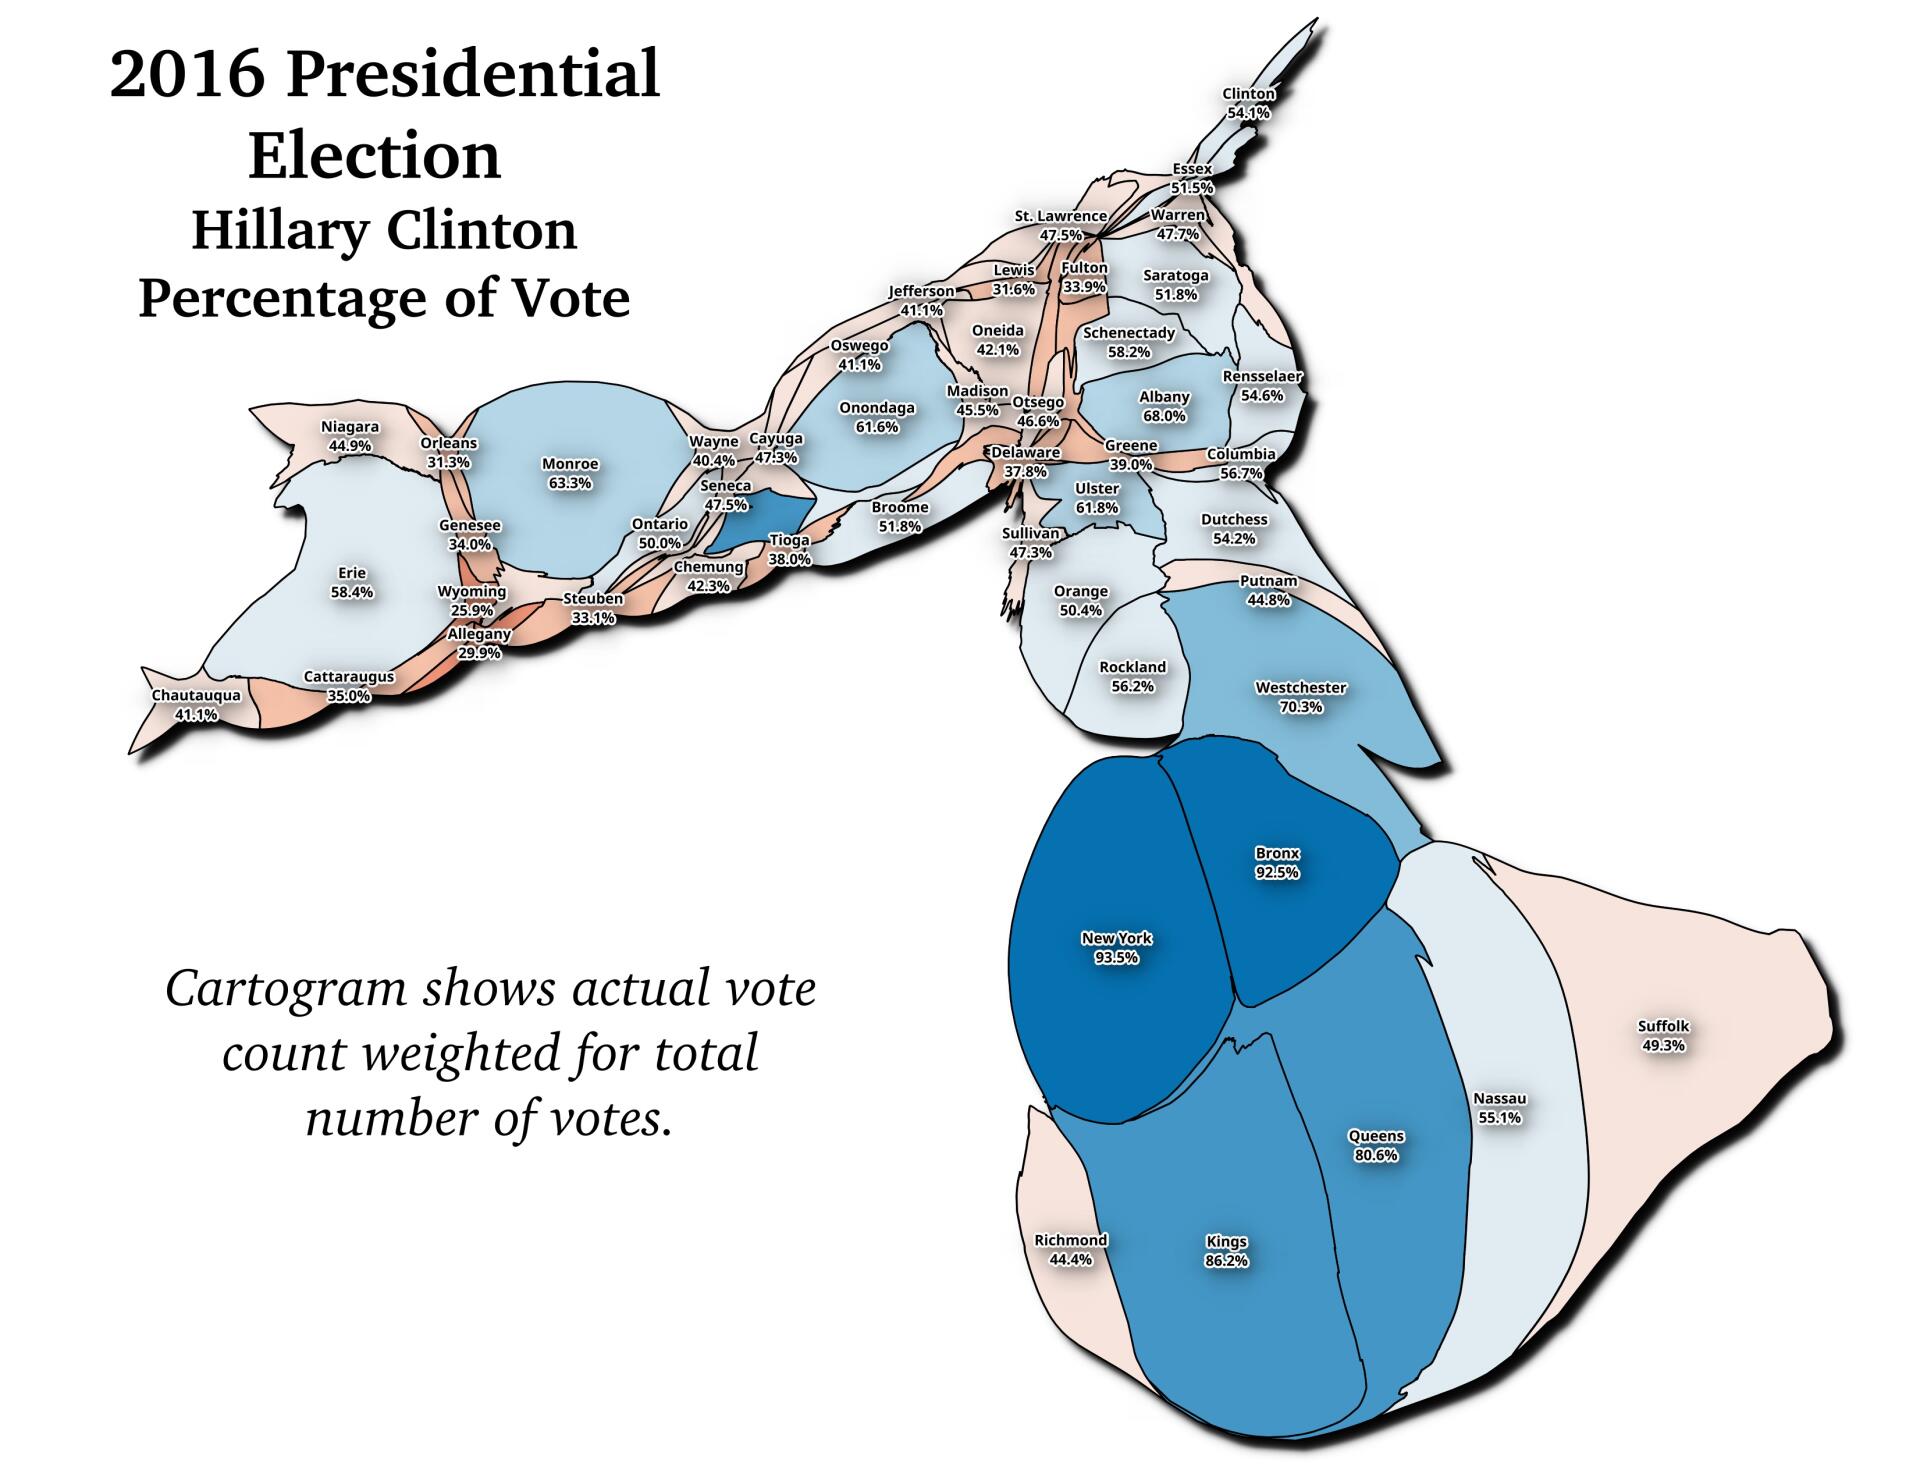
2016 Presidential Election In NY State Cartogram

Download a High Resolution JPEG Image of the 2016 Presidential Election In NY State Cartogram or an Adobe Acrobat Printable PDF of the 2016 Presidential Election In NY State Cartogram.
About Map: 2016 Presidential Election In NY State Cartogram ....
This cartogram shows in area the approximate count of votes versus results by county in New York State. New York City dominated the voting process, with other large urban areas in the state also having disproportionate impact on the total votes.

Bookmark my free Interactive GPS Map for your phone:
https://andyarthur.org/ny
... shows your location as a blue dot in relationship to campsites, trails, state land. This online map requires cell service, won't work in remote country, so also bring a paper map.
Free Download of New & Historical USGS 1:24k Topograpic Maps
Interactive maps with backcountry and roadside camping: New York, Pennsylvania, West Virginia & Vermont. List of NYS DEC Lean-Tos and Firetowers.
Google Spreadsheet with Roadside, Primitive and Pay Campsites
More about Politics...


![Thematic Map: 2024 Presidential Election - Capital Region [Expires November 1 2026]](/data/photo_17216_small.jpg "Thematic Map: 2024 Presidential Election - Capital Region [Expires November 1 2026]")


")
![Thematic Map: The Night they Drove Old Dixie Down [Expires July 31 2026]](/data/photo_25368_small.jpg "Thematic Map: The Night they Drove Old Dixie Down [Expires July 31 2026]")
![Thematic Map: Trump's Election Security Breakdown [Expires July 31 2026]](/data/photo_25369_small.jpg "Thematic Map: Trump's Election Security Breakdown [Expires July 31 2026]")


