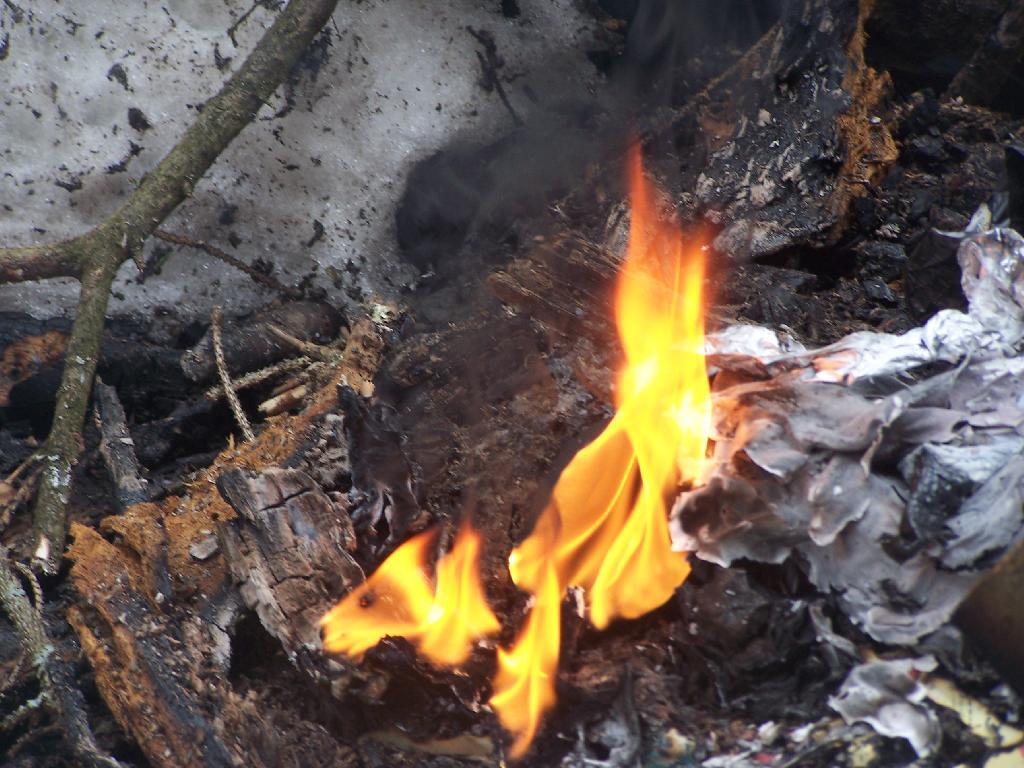
Thematic Map: Average Hottest Day of the Year in NYS 2006-2020

More about Fire...

SVGZ Graphic: Average Drive Time from Nearest Fire Station
SVGZ Graphic: Controlled Burns by County, 2008-2021
SVGZ Graphic: Number of Wildfires by Month in NY State Since 2008
SVGZ Graphic: Wildfires by Cause in NY State
SVGZ Graphic: Wildfires in 2021 by Month
Thematic Map: Active Fire Area - Palisades Fire Overlaid Albany
Photo: Flame Goes Up
Photo: Flames
Photo: Milk Jug 2
Photo: Burns
Photo: Flicker
Photo: Pay Stub
Photo: Starting Some Trash on Fire
Photo: Ashes
Photo: Cookies Box Go Up in Smoke

Leave a Reply

Your email address will not be published. Required fields are marked *